On this page
The evidence
How five minutes of reading becomes a reading profile, and a plan.
The method, the studies and the full reference list. Nothing here is behind a form.
Reading is not a smooth sweep
It feels continuous, but the eyes do not glide along a line of text. They jump, stop, and jump again. The stops last about a fifth of a second, and they are the only moments when the words are actually being taken in. During the jumps, you see almost nothing.
A confident reader stops less often, stops more briefly, and jumps further each time. A reader who is working harder stops more often, stops for longer, and jumps backwards to re-read words already passed. None of this is deliberate, and none of it can be performed or faked.
That is why eye movements are useful. They reflect the work of reading as it happens, rather than the performance a child produces afterwards.
In the research literature the stops are called fixations and the jumps are called saccades.
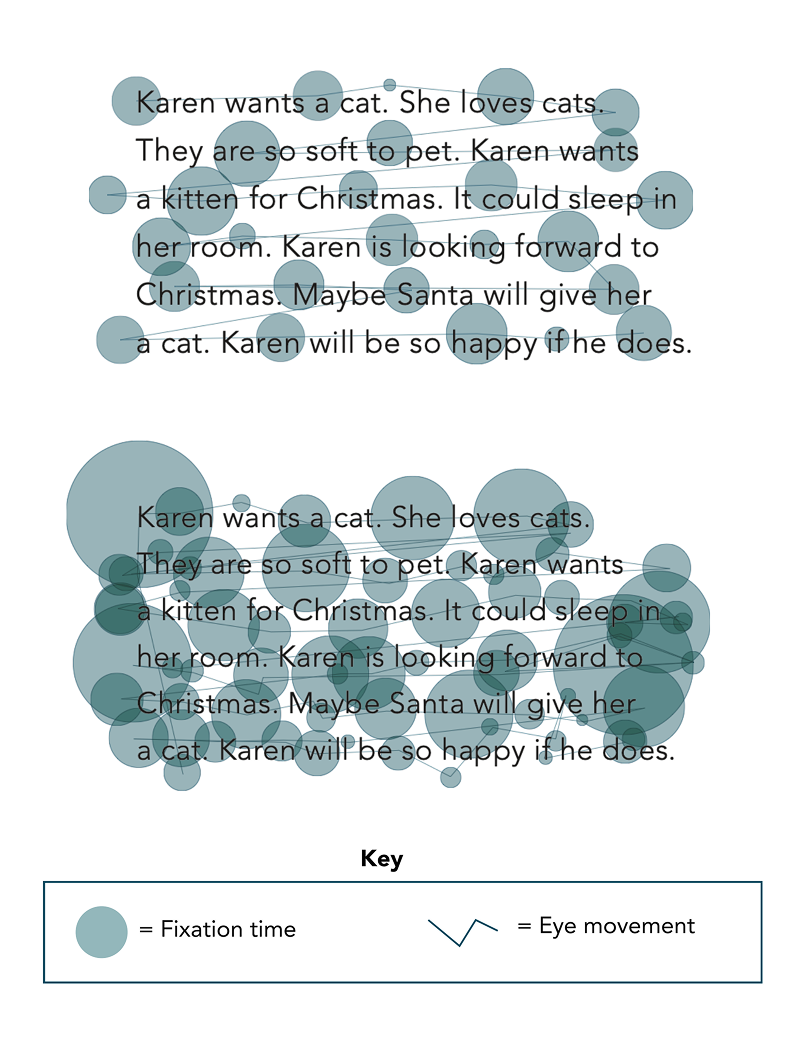
Each circle is a stop, sized by how long the eyes stayed. The lines are the jumps between them. Above: long, confident jumps, brief stops, few backward movements. Below: many more stops, larger and overlapping, and a visible pattern of returning to earlier words. Both children read the same passage. One did considerably more work to get through it.
How the score is made
Predict reading rate. The models estimate words correct per minute for both reading aloud and reading silently, from the eye-movement recording. The two are modelled separately, because they are different skills.
Compare against reference points. That rate becomes a percentile, using established reading-aloud norms combined with Lexplore's own accumulated recordings, drawn from real assessments taken throughout the academic year. A child assessed in October is compared against where children actually are in October, not against a single year-end benchmark.
Balance against comprehension. The score is weighed against the comprehension questions, so that reading quickly without understanding does not inflate it.
Turn it into a recommendation. The profile is mapped to what this reader needs next: where to focus, and reading and practice matched to the level. The score is the input; the recommendation is what a teacher or parent actually uses.
From one five minute assessment: phonological awareness · letter knowledge · reading speed · reading fluency · word decoding · reading comprehension
Decoding plus comprehension
Lexplore’s practice and teacher guides are built on the Simple View of Reading: reading comprehension is the product of decoding and language comprehension. Not a sum, a product, which means a weakness in either one limits the result regardless of the other. It is a simple model with a strong empirical base, and it is why the assessment measures both the mechanics of reading and what a child understood.
Decoding here means working out words from letters and sounds. Language comprehension means understanding the words once decoded, and their meaning in context.
What this does not do
It does not identify anyone. The eye movements are analysed to assess reading. From what Lexplore analyses, it is not possible to determine who was reading. This is not biometric identification, which requires systems built specifically for that purpose.
It does not diagnose. Not dyslexia, not anything else. It indicates where a reader stands, and where looking more closely may be warranted.
It does not decide anything. Results are interpreted by a teacher, or by a parent, alongside everything else they already know.
The evidence in brief
| Measure | Result |
|---|---|
| Identifying readers at risk, first study (3,444 students, grades 1 to 3) | 86% accuracy: 85% of struggling readers correctly flagged, 88% of strong readers correctly cleared |
| Agreement with three US reading tests | 91% average |
| Accuracy against reading-aloud measures, model V5 (1,484 students, grades 1 to 8) | Explains 97% of the variance (R² = .97, p < .001) |
| Test–retest reliability, model V5, one week apart | 85% |
| Independent replications | Multiple research groups |
| Systematic reviews | Several published |
Every figure below is labelled with the model version it belongs to. Accuracy figures from different model generations are not comparable, and are not presented as a set.
Where the method came from
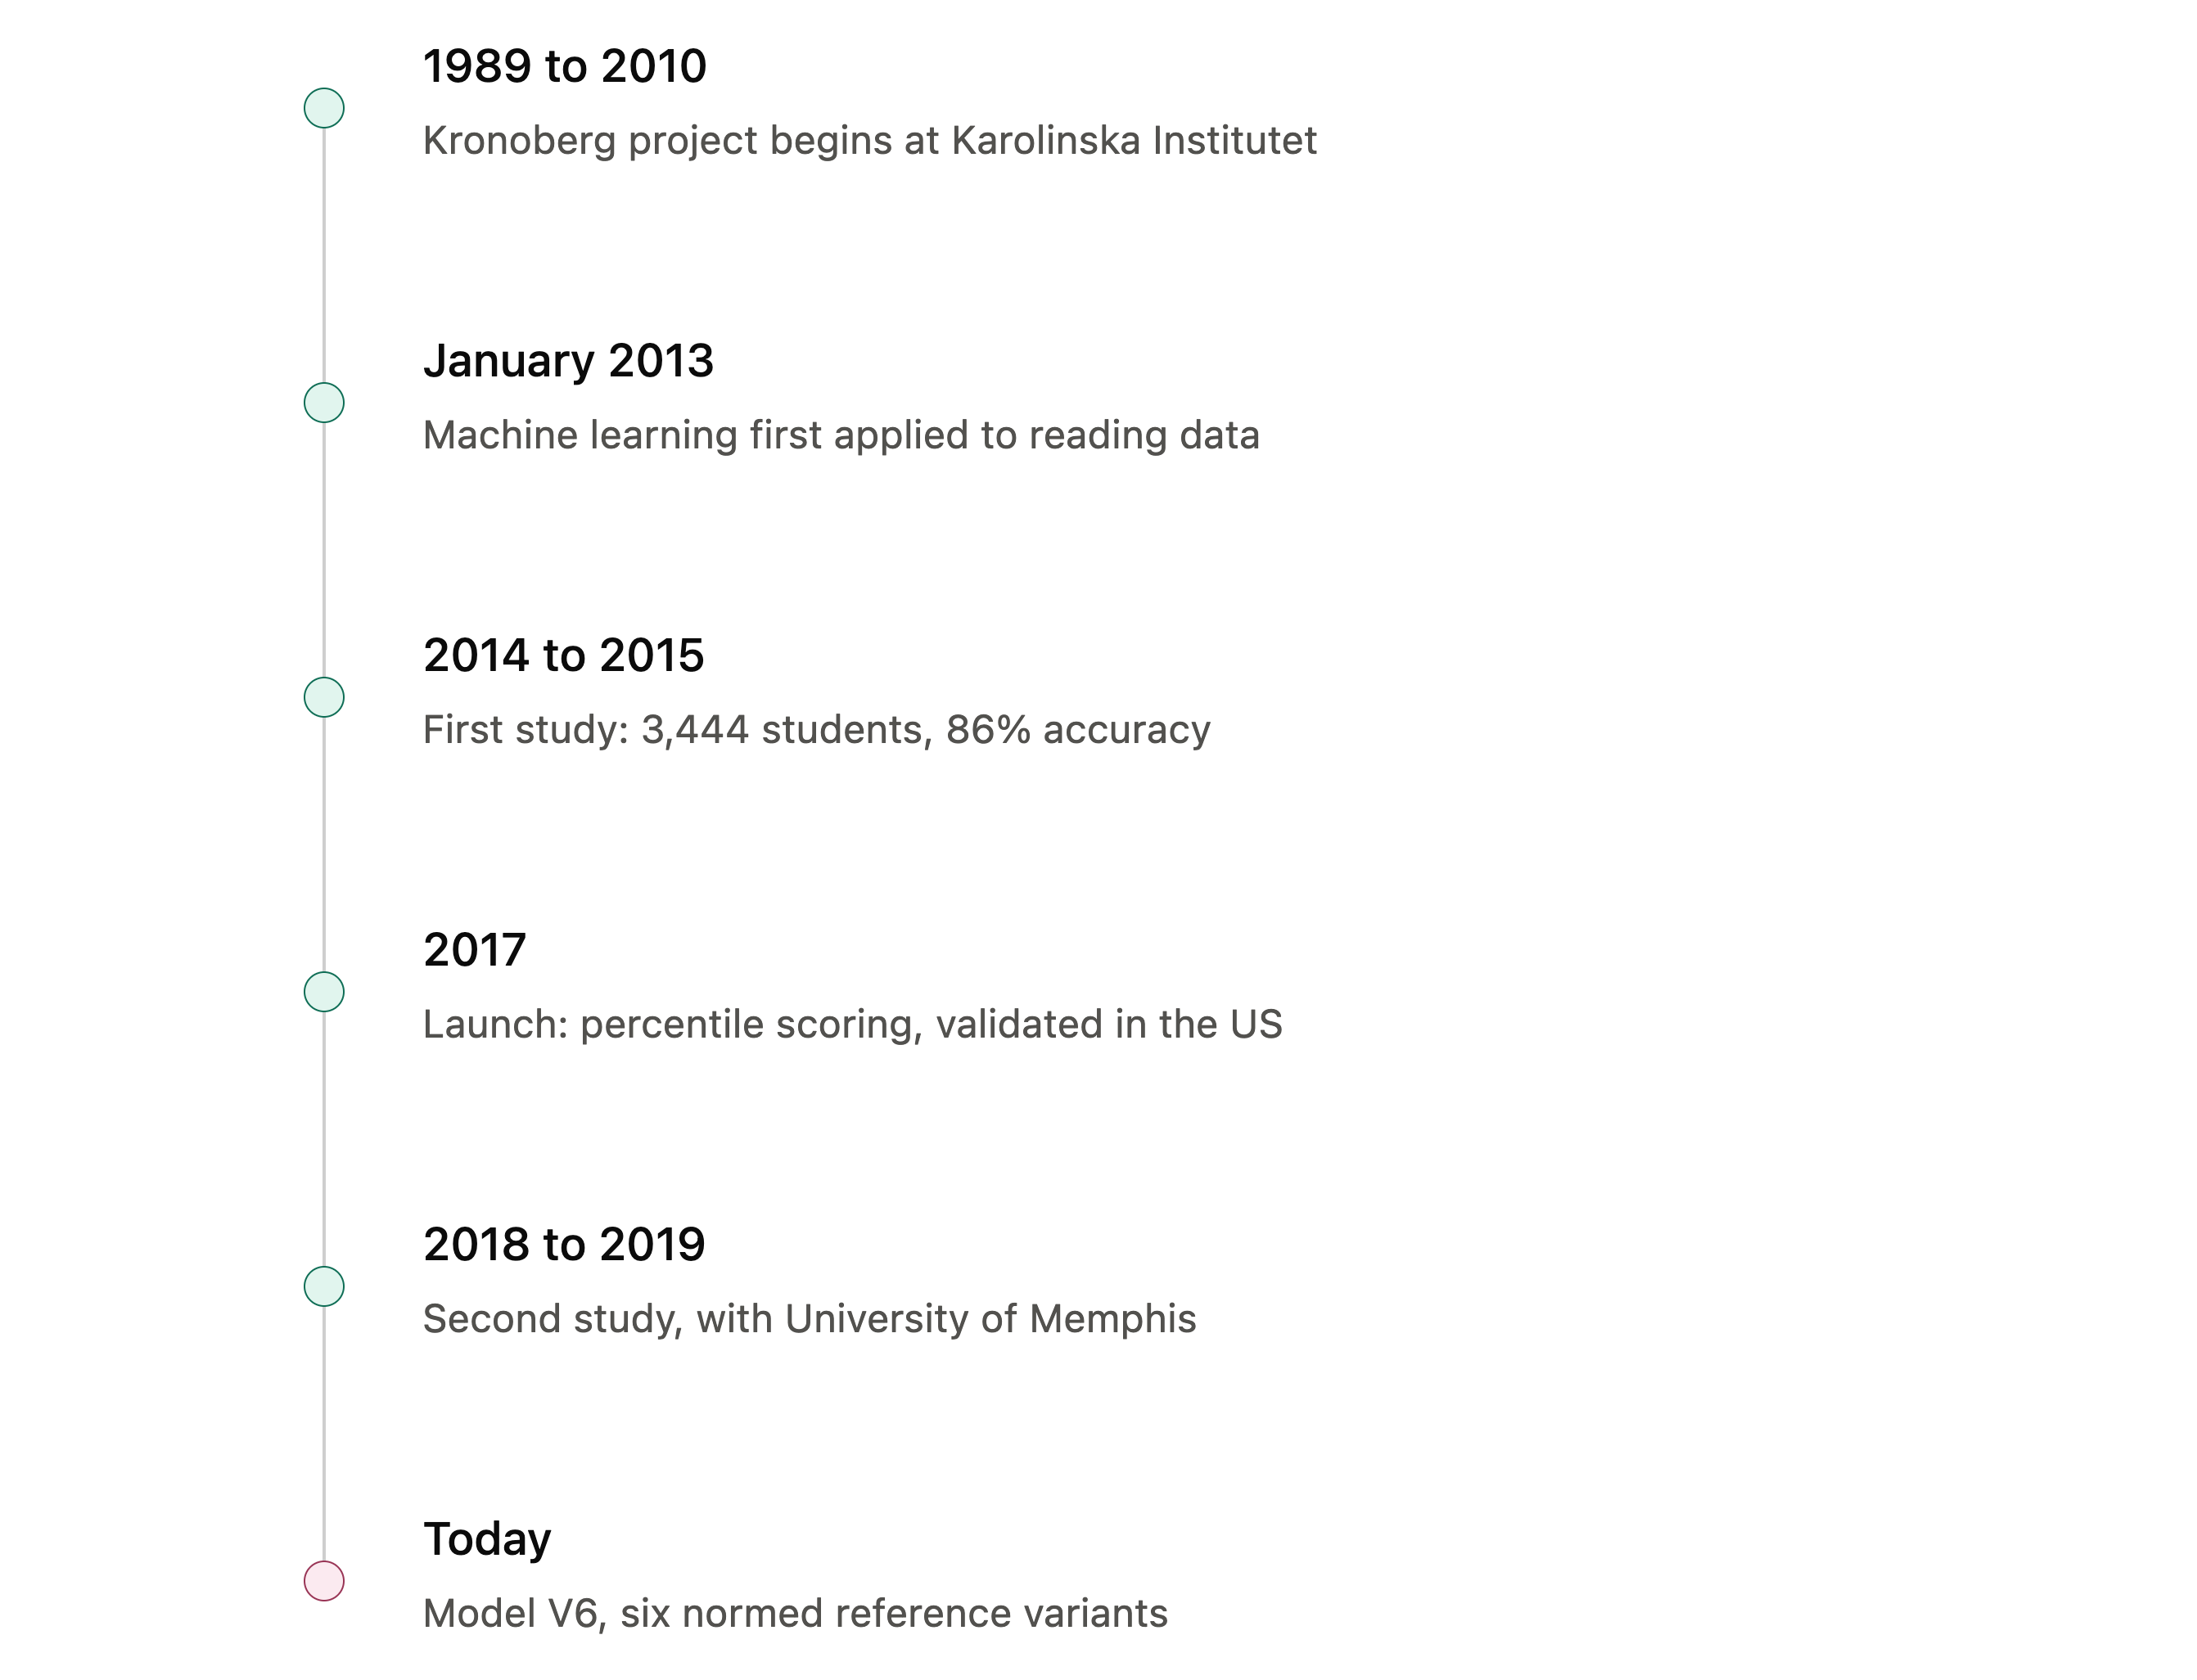
Lexplore’s method is built on data from the Kronoberg Project, a study of reading and writing at Karolinska Institutet that ran from 1989 to 2010 and followed the same readers over time. It recorded eye movements from hundreds of children, with and without reading difficulties, and followed their academic progress from primary school into adulthood. Further data came from the Dyslexia Project in the Swedish municipalities of Järfälla and Trosa.
Analysing that data at the Marianne Bernadotte Centre, part of Karolinska Institutet, researchers Gustaf Öqvist Seimyr and Mattias Nilsson Benfatto showed that statistical models could predict which students would go on to experience reading difficulties from as little as thirty seconds of reading.
The method itself dates from January 2013, when machine learning was first applied to those recordings.
Who built it
Gustaf Öqvist Seimyr researches eye-movement tracking and reading at the Marianne Bernadotte Centre. A computational linguist from Uppsala University, his 2006 doctorate examined readability on mobile devices. His work focuses on how vision functions in health and disease during everyday activities: reading, interpreting images, recognising faces.
Mattias Nilsson Benfatto holds a doctorate in computational linguistics from Uppsala University, awarded in 2012. As a graduate student he developed new analytical methods for understanding how the eyes are controlled during reading, and he continues that work at the Marianne Bernadotte Centre with a focus on the relationship between eye movements and neurological conditions.
Both were named on the Royal Swedish Academy of Engineering Sciences 2019 list of 100 prominent Swedish researchers.
Why this became possible
Eye tracking has been used to study reading for decades; a search for reading and eye movements in Web of Science returns around three thousand titles. What changed recently is that it became possible to do it outside a laboratory, on large numbers of students, and to analyse the results automatically.
Using predictive modelling and statistical resampling on the Kronoberg data, models separated high-risk from low-risk readers with over 95% accuracy, from less than one minute of reading.
The models were trained on original data from around 3,000 students whose eye movements and reading ability had been measured with a range of traditional tests. Training involved identifying and quantifying the relationships between specific eye-movement patterns and reading attainment, followed by validation.
First study: identifying reading difficulties (2014–15)
This study developed the school assessment method Lexplore uses. Eye movements were recorded from 3,444 Swedish students in grades 1 to 3, of whom 1,236 were assessed twice, one year apart.
Rather than knowing in advance which children had difficulties, a traditional inventory was carried out covering word segmentation, rapid naming, made-up-word reading and sight-word reading. A composite of that inventory became the measure against which the models were trained and evaluated, grade by grade.
Result: 86% accuracy. Of the students who were struggling, 85% were correctly flagged; of those who were not, 88% were correctly cleared. In technical terms, balanced sensitivity and specificity.
From a threshold to a score, and into English
At launch in spring 2017 the grade 1 to 3 models reported only whether a student was at risk. With a larger sample, a regression-based model was developed to predict a percentile score instead, taking reading aloud and reading silently into account. It explained 78% of the variance across grades 1 to 3 (R² = .78).
In the same period the English model was validated in the United States against three established assessments: DIBELS (177 students), FAST (130) and STAR (123). Agreement averaged 91%, though the thresholds used to flag students as at risk varied between the tests.
That last point matters. Agreement on where a student sits is not the same as agreement on where the line for intervention should be drawn, and the tests do not agree with each other on that either.
Second study, with University of Memphis (2018–19)
1,484 students in grades 1 to 8 were assessed in California schools across autumn, winter and spring. Lexplore was incorporated into the standard benchmark battery alongside the i-Ready assessment, and reading aloud was assessed throughout by trained research assistants.
A new model used those reading-aloud records as the measure for training and evaluation. Reference points for grade and period were adopted from Hasbrouck and Tindal (2017), which incorporates data from 6.7 million reading-aloud assessments. Predictive validity was assessed against the California end-of-year state test (CAASPP, Smarter Balanced) for grades 3 to 8.
Concurrent and predictive validity
Model V5, grades 1 to 8
| Measure | Result |
|---|---|
| Variance explained against reading aloud | R² = .97, p < .001 |
| Test–retest reliability, same students one week apart | 85% |
| Correlation with i-Ready | r = .75 |
| Correlation with end-of-year state test (CAASPP) | .65 in both spring and autumn |
| Correlation, CAASPP against i-Ready, for comparison | .80 autumn, .85 spring |
| ROC AUC, autumn benchmarks (927 students) | Lexplore .79 · reading aloud .81 · i-Ready .83 |
Two notes on reading this table honestly.
R² = .97 means the model explains 97% of the variance in reading-aloud scores. It is a measure of how closely Lexplore reproduces a trained assessor’s reading-aloud result, not a claim to be 97% correct about a child’s reading in general.
The last row tests how well an autumn assessment predicts meeting the state standard at year end. Lexplore performs comparably to reading aloud measured by trained research assistants, and to i-Ready, and marginally below both. We publish that because a measure that only reported the figures where it leads would not be worth trusting on the ones where it does.
Replication and review
Other research groups have reported similar findings using eye tracking and machine learning. Lexplore’s own results have been independently replicated, and several systematic reviews of the research area have been published. A full reference list is available on request.
How the analysis works today
Current model V6. Three steps: predict words correct per minute for reading aloud and reading silently; convert that to a percentile combining established reference points with Lexplore’s own recordings; balance the result against the comprehension questions.
Reference points are adjusted independently for each of the six normed variants, drawing on the volume of accumulated recordings to produce both relative and absolute scores that reflect how reading develops across the academic year and through the grades.